FIELD DATA
CONDUCTIVITY PULSES

WHAT IS CONDUCTIVITY?
The measurement of a solutions ability to conduct electricity.
SALT =
CONDUCTIVITY
Water quality data from 27 creeks monitored by dedicated Streamkeeper
organizations
The BC Water Quality Guidelines for Chloride
Long-term chronic (LTC) chloride exposures are recommended to stay below a 30 day average concentration of 150mg/L Cl- (Conductivity ~400uS/cm)
Short-term acute (STA) chloride exposures are recommended to be below a maximum concentration of 600mg/L Cl- (Conductivity ~2,000 uS/cm)
(Clare Kilgour, UBC)

(Carley Winter, UBC)
During the winter, when temperature (indicated with the black line) is at its lowest, spikes in conductance are observed!
Below is the total percent of days from November-March during which chloride levels exceeded BC's water quality guidelines
The blue-coloured bars represent the streams where the presence of fish was confirmed by surveys.
Orange-coloured bars display streams which were surveyed, but no fish were present.
Surveys were not performed in streams shown with grey-coloured bars.
Days above BC's chronic water quality guideline
(150mg/L Chloride)

(Clare Kilgour, UBC)
Days above BC's acute water quality guideline
(600mg/L Chloride)

(Clare Kilgour, UBC)

(Clare Kilgour, UBC)
WATER GRAB SAMPLES
During the winter, Clare and Carley (UBC students), collected water grab samples in some of the study creeks. The grab samples were analyzed for chloride content to confirm that the conductivity spikes recorded by the in-stream data loggers are indeed caused by road salt.

Chloride is contributing to majority of the spike in conductance!


FISH SURVEYS
IMPACTED SITES:
Surveyed sites which are located closer to urbanized areas and roads, thus theoretically more exposed to potential contaminants.
NON-IMPACTED SITES:
These sampling sites are not necessarily free of contaminants, but rather further from direct runoff origins.
SPRING 2024 FISH SURVEY

(Carley Winter, UBC)
FALL 2024 FISH SURVEY

Fish surveys were conducted to get a deeper understanding of local fish populations across streams.
Data were provided by:
-
Alouette River Management Society
-
Eagle Creek Streamkeeper Society
-
Hyde Creek Watershed Society
-
Still Creek Moon Arts Society
-
Stoney Creek Environment Committee
-
The WaterWealth Project
-
Yorkson Water Enhancement Society
FALL 2023 FISH SURVEY

(Carley Winter, UBC)
SPRING 2023 FISH SURVEY

INVERTEBRATE SAMPLING

(Graphics: Hannah Case)

Nine out of our thirteen partnered stream stewardship groups participated in the optional invertebrate sampling.
Displayed are the 2024 invertebrate surveys showing the abundance and diversity of invertebrates sampled in impacted and not impacted sites at each sampling location.
Nine of our partnered stream stewardship groups participated in this years sampling.
(Sofia, SFU)


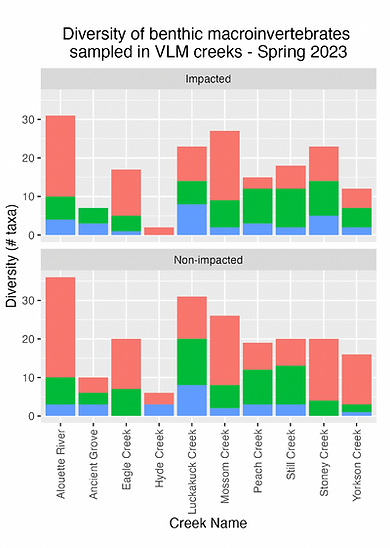
This bar graphs below display the number of taxa sampled during the spring of 2023. The proportion of invertebrate species categorized as pollution intolerant, semi-tolerant, and tolerant, represented by distinct colours (red, blue, & green)


(Clare Kilgour & Carley Winter, UBC)

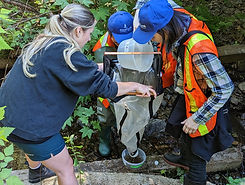
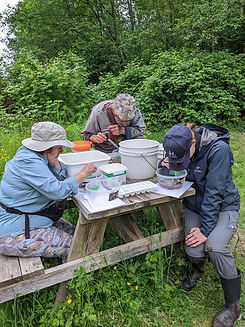
Invertebrate sampling is no easy task!
Volunteers and graduate students spend multiple hours in the field,
identifying thousands of invertebrates!
After sampling was completed, invertebrates are released back to their streams.


